-
Best Australian Pokies Free No Download No Registration
Poker Tournaments Brisbane Casino
Tips No Deposit Pokies 2024
Deposit Casino Pokies Win Real Money Australia
Australia Casinos That Accept Skrill 2024
Commercial Hotel Werribee Pokies
Try Pokies in Australia Machines for Free
Bingo Bonuses AU
Australian Roulette Online Game
Poker AU Casino
Amazon Product Rating & Review Statistics
*Team final project completed for Harvard’s Linear Models course, STAT 139, together with Phoebe Wong, Zizheng Xu, and Yiming Xu*
Overview
Amazon showcases more than 560 million products as of January 2018. This immense repository gives rise to transaction rates that brought in nearly 178 billion dollars of net revenue for the company in 2017 alone. Amazon’s influence has reshaped how products are discovered, sold, and shipped, catalyzing a major shift in balance from traditional retail to e-commerce. One interesting byproduct of the rising e-commerce trend is an increase in transparency surrounding the quality of products. Amazon facilitates this through their product reviews, a feature where customers who have verifiably purchased the product can comment on their experience, ascribing it an integer numerical value from 1 to 5. Presumably better ratings are correlated with better products, but are ratings also correlated with price? Are ratings correlated with the number of reviews? Are they dependent upon the type of product?
The underlying psychology of how people rate products is ambiguous. When price is involved, one line of logic may be that we should expect expensive products to be higher quality, and thus earn higher ratings. On the other hand, if the product is exorbitant, the reviewer may be more critical in their judgement of its worth. In the context of categorical comparisons, one would expect customers to be more critical of products that have a greater impact on their wellbeing. For example, someone who buys a computer with a spotty internet connection would likely leave a lower rating than someone who buys a fancy chair that wobbles. This is because the inability to browse the internet has more of a negative impact than being uncomfortable in a chair, even though the two objects may cost the same. In short, our project aims to clarify these psychological quandaries using data on Amazon product reviews, prices, and ratings.
Hypotheses of Interest
There are two main hypotheses we investigated:
Is there a correlation between product ratings on Amazon and various product-related features such as price, number of comments, and the superlatives used in comments?
Is there a significant difference in mean rating between product categories or between company brands within a single category?
Data
The dataset we used was sourced with the permission of Professor Julian McAuly from the University of California San Diego. A publicly available sample of the datasets can be found here. This dataset contains product reviews and metadata from Amazon. In total the data accounts for 142.8 million reviews spanning May 1996 to July 2014. The structure is as follows:
Reviews:
Reviewer id – Unique identifier for each review
Product id – Unique identifier for each product
Reviewer name – Account name of the reviewer
Review text - Text of the review
Review summary – Summary of the review
Product rating – Rating given to the product for each review
Helpfulness rating – Number of people that found this review helpful
Unix review time – Unix timestamp of review
Review time – Datetime timestamp of review
Product metadata:
Product id – Unique identifier for each product
Title – Name of product
Price – Price of product
Image url – URL of image
Related products – a list of suggested related products
salesRank – salesRank information
Brand – Brand to which the product belongs
Categories – Categories to which the product belongs
We merged the reviews and metadata into a single dataframe and isolated products that had more than 30 reviews. This was to ensure products with just a few reviews wouldn’t become outliers that disproportionately affect the methods that weight the mean rating of each product equally.
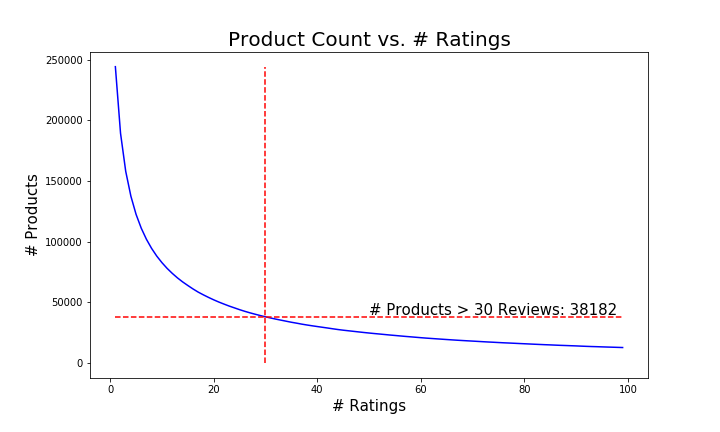
The visual above shows the evolution of the volume of products vs. the number of reviews per product, along with the cut we made for the electronics category. Note, some of the titles had null values. We decided to purge the products with no title to allow for brand comparisons.
Inter-Categorical Tests
In our second hypothesis we sought to address the question of whether there was a significant difference in mean rating between categories of products. This was to elucidate the question over whether people are more critical of products that have a greater capacity for failure.
In order to carry out multiple comparisons between different categories, we considered doing an ANOVA test or a series of non-parametric tests with a Bonferroni correction. We made the decision to weight each product in each category equally. To do so we grouped the data in each category by product and averaged the ratings. We chose to examine comparisons between the following four categories: Baby Products, Musical Instruments, Sports/Outdoor Gear, and Electronics. A visualization of the distributions is provided below:
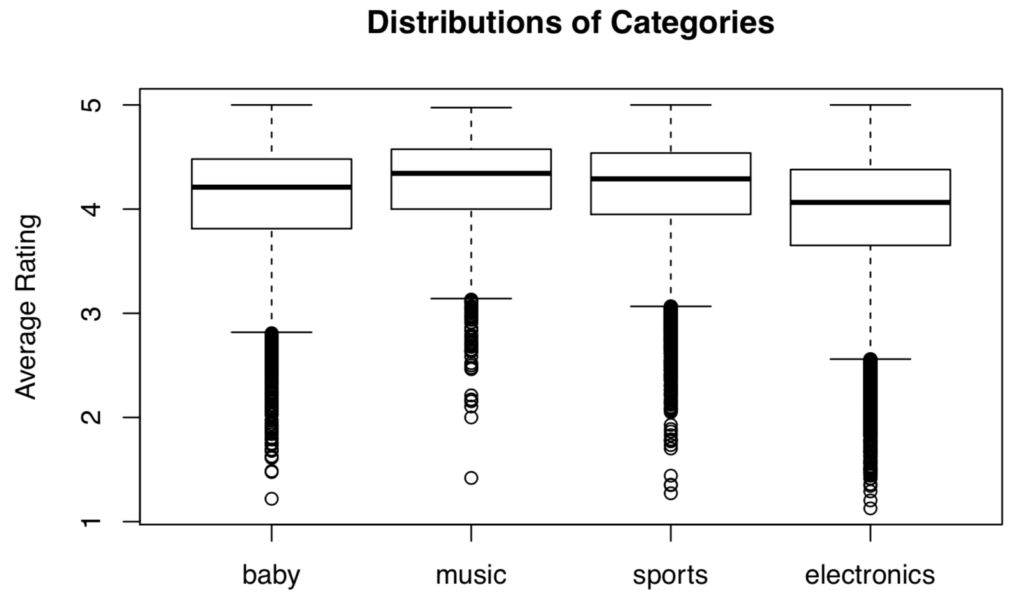
It seems that the spreads are more or less the same, but each distribution is clearly left skewed. To be conservative and to introduce variety into our report, we decided to run a series of wilcoxon signed-rank tests with a Bonferroni correction to test whether the group means were different or not.
Results
The results of the signed-rank tests are summarized in the table below:
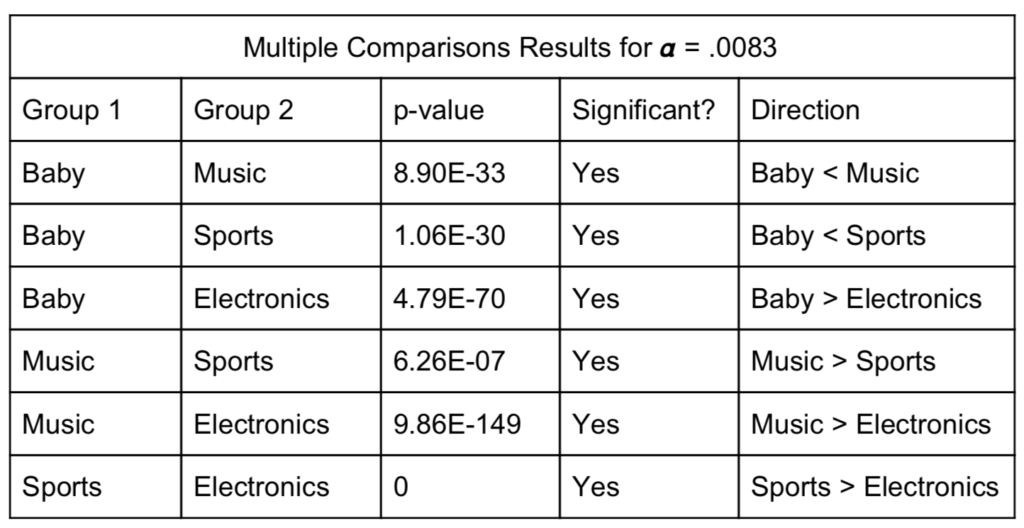
It turns out that the sample sizes were so large for each category, the p-values were minuscule and the medians were all determined to be significantly different. The pecking order for medians from highest to lowest were music, sports, baby and electronics in that order. Furthermore, the median rating for electronics was substantially lower than the other categories.
Discussion
While the differences in the median rating for each category were all significant, it is interesting to see how much lower the median rating for electronics is than the rest. This could be an indication that people, in general, are more critical of electronic products. Harkening back to the example from the introduction, it is possible that this is because the cost of failure is higher for electronics than for similarly priced sports gear, musical instruments, or baby products. As another example, compare a $90 cell phone to a $90 pair of soccer cleats. If your cleats turn out to be uncomfortable and/or fall apart easily, the worst case scenario is you cannot play soccer for the time being. If your cell phone freezes or breaks easily, you cannot make any calls, use it to browse the internet, or a number of key features that people expect cell phones to have these days. However, it is important to remember that this is speculation, and we haven’t controlled for several factors that may also influence the median rating in a category. One example of a possible set of confounding variables are the differing demographics of the people shopping in each category. It is possible that the average age of people shopping for electronics is different than those who are buying baby toys, as young parents who are taking care of children may not have as much time or money to invest in a new speaker system or gaming console. Overall, it is interesting to get directional reads from the categorical comparisons, but in the next section we will take a deeper dive to gain new insights from making intra-category comparisons.
Linear Model & Analysis
We set out to build a complex linear model in order to identify significant features that determine the rating of an Amazon product. This process was very involved and made use of the following techniques:
- Data transformations
- Feature engineering
- NLP sentiment analysis
- Feature selection
- Weighted least squares regression
- Bootstrapping
The motivations for these methods will be unpacked in the sections to come.
Data Transformations
Dependent Variable of Interest: Amazon Product Rating
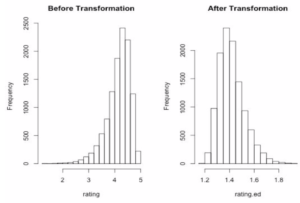
Our response variable is the mean rating for each product (0-5). However, it’s quite left-skewed in its raw unit, which challenges the assumption of constant variance in linear regression. In order to transform the response and at the same time preserve some interpretability, we flipped the response variable around its mean to make it right-skewed, and then applied a log transformation. The log transformation allows us to interpret the mean rating on the median scale.
![]()
Feature Engineering
From the original dataset, for each product we have information on the price, as well as a catalogue of all the reviews and associated ratings the reviewers gave. We aggregated the ratings together to get the mean rating, which is the response variable we are trying to model. Two other features we pulled from the original dataset were the price of the product and the number of reviews it got. From there, we delved into linguistic features of the reviews, looking at:
- Mean character count
- Mean word count
- Mean number of exclamations and question marks
- Mean number of words in all caps
We used the exclamation marks and all-caps word counts as a rough measure of extreme emotion in reviews which might have an interaction with the sentiment of the review (e.g., positive reviews are more positive if it has strong emotions, same for negative reviews).
In addition, we derived a sentiment score for each review using the AFINN dataset. The AFINN sentiment lexicon provides numeric positivity scores for each word. The scores range between -5 and 5, with negative scores indicating negative sentiment and positive scores indicating positive sentiment. We then aggregated the sentiment score per product and used that as a feature on the basis that product ratings might be higher if the average sentiment score of the reviews is positive. A summary of the results is included below:
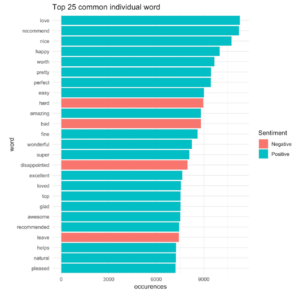
Including the text related features, the predictors had a non-linear relationship with the response. We also saw that the constant variance assumption had been clearly violated from the residuals-fitted value plot. Thus, we transformed some of our features as follows:
Log-transformed: Mean product price, Number of reviews per product, Mean character count, Mean word count, Mean number of exclamations and question marks.
Added one and then log-transformed: Mean number of words in all caps.
When we re-plotted the residuals, the non-constant variance problem had been alleviated greatly.
Model Building
We first built a simple linear regression model (call it model 1), using the transformed price as the predictor and the transformed rating as the response.
![]()
After inspecting the result, the assumptions of the model fitted well. There was a weak positive relationship (0.0151, p < .001) between the product rating and price, which is thought-provoking. Note that because we’ve flipped the rating around its mean, we have to take the opposite direction when interpreting the coefficients in the original unit.
We then incorporated the natural language processing (NLP) features of reviews into our model. Firstly, we included all the main effects of this new model (call it model 2). Model 2 showed a weak (but significant) positive relationship between price and rating. Meanwhile, most of the NLP features had a significant relationship with rating.
Finally, we carried out an ESS F-test, the result of which suggested including the NLP features significantly improves the model with a p-value of <2.2e-16.
Stepwise Feature Selection
To select the best combination of the NLP features and the price predictor, we added all main effects and the 2nd order interactions terms from model 2. We then conducted a stepwise model selection with model 1, and the “kitchen sink” model as the lower and upper bound of the scope respectively, and let the result of the model selection as our final model.
After checking the assumptions for the final model, the constant variance assumption has been violated. From the residuals vs fitted plot and the scale location plot, we observe that variance increases with fitted value, which indicated that a weighted least squares approach might fix the assumptions of our model.
Since our independent variables are aggregated, it’s natural to use 1/(# of reviews) as the model weight (with the idea that more reviews will result in less variance). However, after making this adjustment, the non-constant variance problem was still an issue:
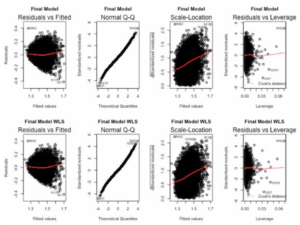
To get a more reliable result on our inference, we ran 500 simulations to construct the 95% bootstrapped confidence intervals for each coefficients. These estimates and confidence intervals are reported in the table below:
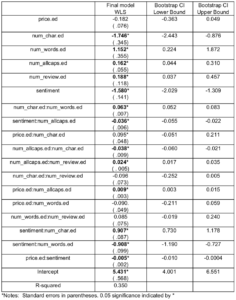
From the table above we can see that the estimate from final model indicates log-transformed price still has a positive relationship with the mean log-transformed product rating, however the confidence interval shows that this relationship is not significant controlling for all important confounding variables.
Interestingly, most of the linguistic features have significant relationship with rating. Particularly, sentiment score of reviews has a significant positive relationship (with a coefficient of -1.58) with product rating, meaning that the more positive the reviews are (indicated by sentiment scores), the higher the product rating.
Discussion
NLP Features
We have applied standard natural language processing on the product reviews. However, there were some confounding effects we did not consider. For example, we used the number of all cap words as a measure of extreme emotion, however, some common emotion-neutral acronyms are all caps, e.g., PDF, DVD which we did not account for. Furthermore, we only considered unigram (one word unit) in our features, based on how the ASFINN lexicon is trained and to keep the computation relatively simple. Looking forward, we could take into consideration different ngrams (e.g., batches of words) to account for sentiments of batches of words (e.g., consider “not good” as negative).
We used ASFINN lexicon to weigh the sentiments of individual words in the review. ASFINN lexicon was trained on Twitter, which might not contain domain-specific words that are used in reviews in product. Since we can only estimate the sentiment score of reviews that contain words that exist within ASFINN lexicon (2477 words), we might lose some information of reviews that use domain-specific language that is not included in the ASFINN lexicon. In the future, we could look for a lexicon that is trained on review domains, particularly product-related domain.
Weighted Function
We applied the weighted least squares to adjust for the non-constant variance problem. We tried different functions of the weight, such as 1/(# of reviews), 1/(predicted values), 1/(number of reviews*predicted values), but none of them had a good performance on alleviating the problems, and even worsened the distribution of the residuals. Therefore, we turned to another way of doing this – conducting WLS with unknown weights and determining the weights through Iteratively Re-weighted Least Squares. However, that still performed poorly on our problem.
Therefore, we resorted to using bootstrapping to get a reliable result on the inference. We only used the estimates from the WLS for our final model and made judgement on whether the coefficients are significant or not on the confidence intervals drawn by bootstrap.